


Once again it is time to show our figures about projects and products in 2016. Compiling this info takes only a few minutes (advantages of having everything electronically recorded) and it is a great way to present some numbers to our potential clients. Of course, numbers alone mean nothing and some explanations are required, but they are a good starting point when talking about productivity, challenging chemistry vs. normal chemistry and others.
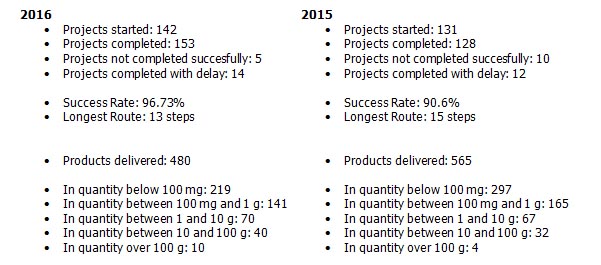
Figures for started and completed projects are a bit higher than in 2015, because 2016 has been a bit special. More projects and more challenging than ever. Our success rate (representing the projects where we did deliver products) is higher than in 2015, but some of the projects were greatly delayed due to the nature of the chemistry involved. Once again, our clients are giving us projects which are really difficult. Again, things that apparently other companies cannot do or where we are more reliable. Just an example: a client gave us three molecules to prepare. When we delivered the first one, they congratulated us because that particular project have been already given to another two CROs without success. So we live to serve.
Our longest linear route in 2016 was only 13 steps, and as usual related with drug discovery.
In 2016 we shipped less products than the previous year: 480 vs. 565. This is because we completed some projects involving hundreds of grams. Those projects take longer and involve a quite different approach to chemistry, so obviously, the productivity in terms of products per person decreases.